Chicago Heat Wave of 1995-Midway Airport
Introduction
Text-to-speech Audio
Images
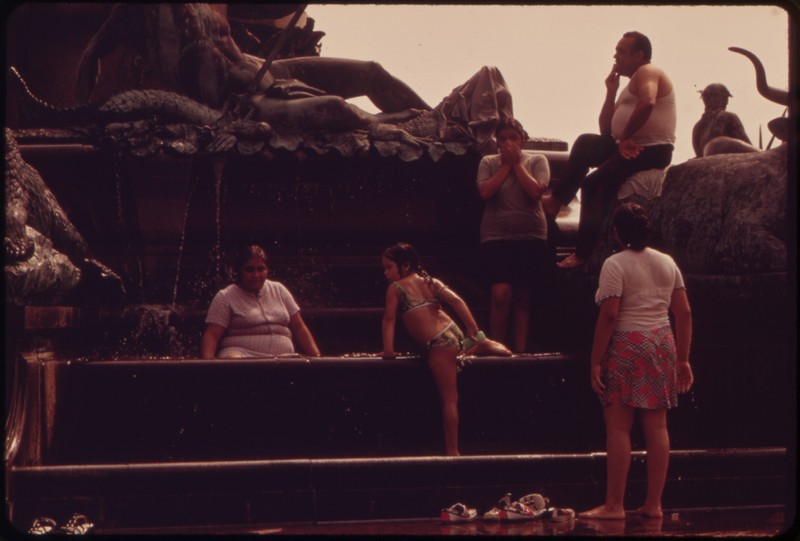
Public fountains are popular destinations during heat waves, especially in neighborhoods without reliable air conditioning. (Wikimedia Commons, Environmental Protection Agency)
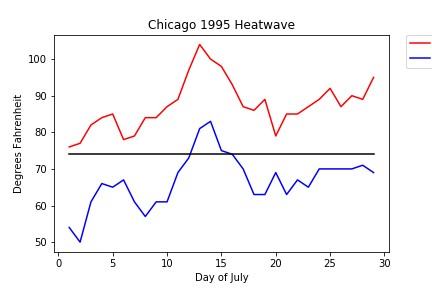
Plotted observed temperatures from O'Hare International Airport. Red Lines are daily max temperatures, Blue Lines are daily minimum temperatures, and the Black Line is the July 1960-2016 mean temperature. (Wikimedia Commons, Robertson713325)
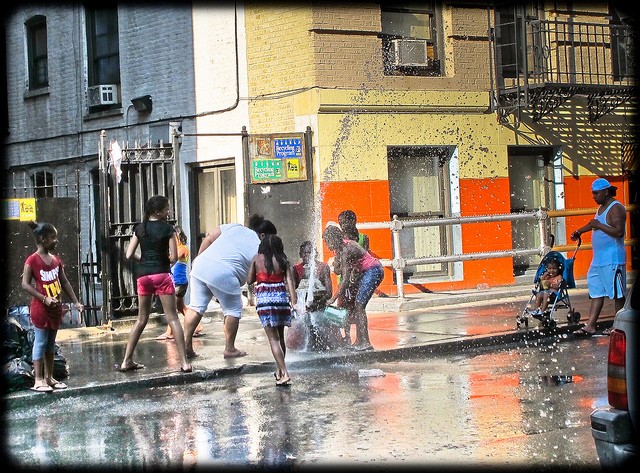
Broken fire hydrants can be a source of fun and relief during heat waves. During the Chicago Heat Wave of 1995, fire hydrants were sometimes intentionally uncapped to allow for some relief for residents, resulting in a water shortage in those areas. (Flic
Backstory and Context
Text-to-speech Audio
Local news outlets were sent into a frenzy as they reported the heat wave about to settle over the city of Chicago, warning viewers not only about the extreme weather conditions, but about their potentially deadly effects. Stay where it is cool, they warned, and drink lots of water. As the heat stifled the city underneath, death tolls began to rise. Under normal weather conditions, the average amount of July deaths per day in Chicago is 72, but as temperatures climbed, the number of daily deaths neared 400. Even when the heat began to subside, it continued to claim victims in overcrowded hospitals and “oven-like” homes. At its hottest, the thermometer at Midway Airport recorded a temperature of 106 degrees Fahrenheit, but the combination of the heat and humidity made the air feel more like 120 degrees Fahrenheit.
The city’s services had little time to plan their response to the crisis. Hospitals began to divert patients needing care to other hospitals in the area. As the heat wave advanced and hospitals continued to reach their capacity, waits and drives grew longer. Chicago morgues, like A.A. Rayner & Sons as featured by the New York Times, ran out of cooler space for victims’ bodies. Volunteers parked refrigerated trucks outside the morgue to keep the bodies cool, and as the seven trucks available filled, volunteers offered their own cars to handle the overflow. Even volunteered space began to run out, and soon victims had to be left in their homes until emergency workers and volunteers could find room for them. Funerals were held back-to-back and embalmers, both volunteer and paid, worked 12 to 13 hour days just to keep up with the work. The mayor of Chicago at the time, Richard M. Daley, and many members of his Cabinet, were criticized by members of the public in Chicago and beyond not only for failing to implement a sufficient emergency plan in the case of a heat wave, but also for expressing skepticism about the deaths being caused by the heat. Not enough cooling shelters were implemented, critics argued, and they were not accessible to those who needed them. The government’s heat emergency plan was a page and a half at the time of the heat wave’s onset.
The heat wave swept the entire midwestern United States, but Chicagoans died at a disproportionate rate, and scientists and climatologists began to examine the cause of those deaths. In 1996, environmental scientists hypothesized that the asphalt and concrete of Chicago’s infrastructure actually made the temperature rise even more in a phenomenon called an “urban heat island.” According to Kenneth E. Kunkel, et al., “Maximum temperatures were 1.6 degrees Celsius higher in the city center (Midway) than in nearby suburban and rural areas. At night, the city center was 2.0-2.5 degrees Celsius warmer.”
The conversation surrounding the Chicago Heat Wave of 1995 changed when Eric K. Klinenberg began to compare the maps of urban poverty in Chicago and the areas in which heat-related deaths were most concentrated. Instead of discussing environmental effects, social and economic issues began to surface as the main related talking point. A disproportionate number of heat wave victims were elderly, impoverished, African-American, or a combination of the three. Elderly victims did not have anyone to check on them or take care of them. For anyone living in an area with a higher crime rate, where housing is more affordable for people experiencing poverty, unlocking or opening windows was not an option because it increased the risk of being robbed. Officials who discovered the bodies of isolated victims described their living conditions as “oven-like.”
When a second heat wave threatened the city of Chicago only two weeks after the Chicago Heat Wave of 1995, city officials learned from the political fallout and the threat was taken more seriously. A committee of city employees were tasked with calling each of the city’s elderly, hospitals were staffed with extra volunteers, and cooling centers were not only more numerous but were placed in areas where vulnerable populations were now known to exist. The forty-one unclaimed victims of the Chicago Heat Wave of 1995 were buried in a mass grave at Potter’s Field in Homewood, Illinois.
Sources
"Chicago Heat Warning." The Washington Post August 12, 1995. Final ed.
"Chicago Officials Mobilize on Heat." New York Times August 01, 1995.
Johnson, Dirk. "179 dead in Chicago heat wave as national toll reaches 360." New York Times July 08, 1995.
Johnson, Dirk. "Mobilized, Chicago Beats Temperatures Near 100." New York Times July 31, 1995.
Klinenberg, Eric K.. "Denaturalizing disaster: a social autopsy of the 1995 Chicago heat wave." Theory and Society, vol. 28. Published 1999. PubMed.
Kunkel, Kenneth E., Stanley A. Changnon, Beth C. Reinke, and Raymond W. Arritt. "The July 1995 Heat Wave in the Midwest: A Climatic Perspective and Critical Weather Factors." Bulletin of the American Meteorological Society 77, no. 7 (1996): 1507-518. doi:10.1175/1520-0477(1996)0772.0.co;2.
Terry, Don. "Heat Death Toll Rises to 436 in Chicago." New York Times July 20, 1995.
Terry, Don. "In This Heat Wave, The City Didn’t Work." New York Times July 23, 1995.
Terry, Don. "U.S. Agents in Chicago Track a Subtle Health Hazard: Heat." New York Times October 04, 1995.
Terry, Don. "With Heat’s Toll Still Being Tallied, Chicagoans Line Up for Grieving." New York TimesJuly 24, 1995. Late ed.
Whitman, Steven, Glenn Good, Edmund R. Conoghue, Nanette Benbow, Wenyuan Shou, and Shanxuan Mou. "Heat-Related Mortality—Chicago, July 1995." JAMA: The Journal of the American Medical Association 274, no. 8 (1995). doi:10.1001/jama.1995.03530080018014.